Develop LoRa Applications by Using Node-RED
(The original Chinese version of this article was written by Hsin-Yu Ho and published on MakerPRO)(The original Chinese version of this article was written by Hsin-Yu Ho and published on MakerPRO)
After reading the article “Basic Application and Tutorial of LoRa G-IoT”, we’ve known how to publish data from LoRa to MQTT server. Now we are going to learn how to write Node-Red program and send data to the network monitoring interface we designed.
1. After signing up for IBM BlueMix, click “Boilerplates” under “Platform” in the left-hand side from this link, then click “Node-RED Starter”, and you will enter the interface of Node-RED application after you click the link it generates.
Note: If you cannot find “Node-RED Starter”, you have to select “US South” in the “Region”, then create and name your space.
2. After entering Node-RED, click “Node-RED editor”, and you will see the default temperature sensor.
3. After entering the page of editor, copy the source code from this link, select “Clipboard” in “Import” from the upper right, then paste the source code. After this, you will see the implementation of transmitting LoRa’s data to location monitoring on Google Map.
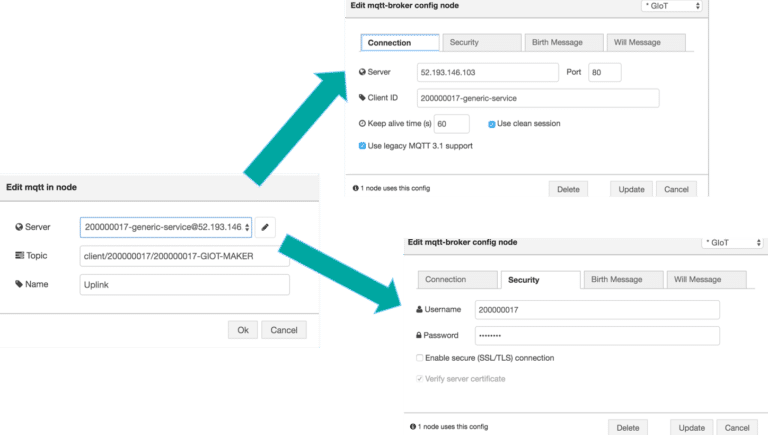
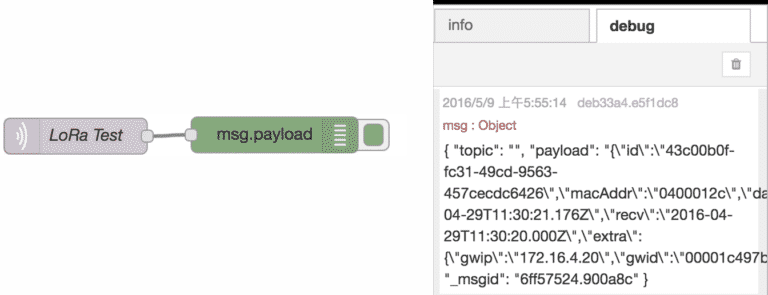
4. Then, we double click “LoRa Node” in the mauve rectangle. It’s an input node of MQTT. We fill in the information we got previously and complete subscription. You can also drag a MQTT node and payload node to link up, then click “Deploy” in the upper right. Plus, you can check if data are pushed from the debug column in the right-hand window. If not, you have to go back to MQTT node to examine any possible issues in setting.
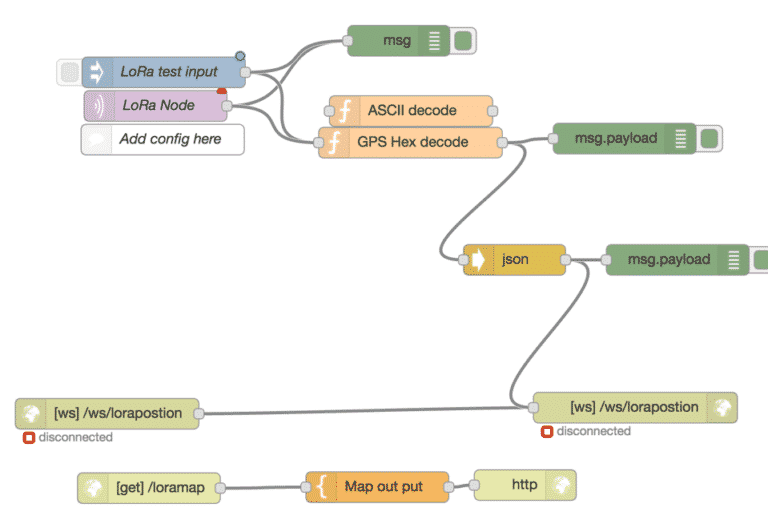
From the flow chart above, you can find that the function node can be divided into two decoders, ASCII and GPS Hex. Since the data pushed by LoRa have these formats for users to choose, we need to connect the corresponding functions. If the setting in MQTT is correct and the data show up in the debug column, we can type:
http://{The name you set for IoT service}.mybluemix.net/loramap
After this, you will see the GPS data marking on Google Map, which means it succeeded.
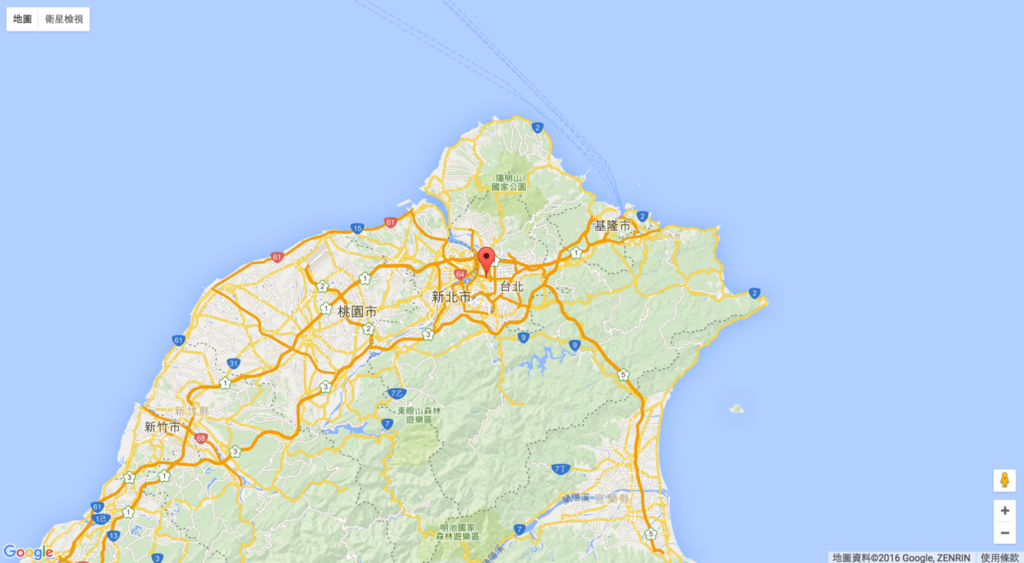
In the next part, we’re going to finish the monitoring interface of LoRa.
1. At first, we select “Manage palette” on the main menu, switch to “Install” column in the left-hand side, and type “dashboard” in string searching. We Install “Node-RED Dashboard” from the menu so that “dashboard node” will show in the left-hand node column.
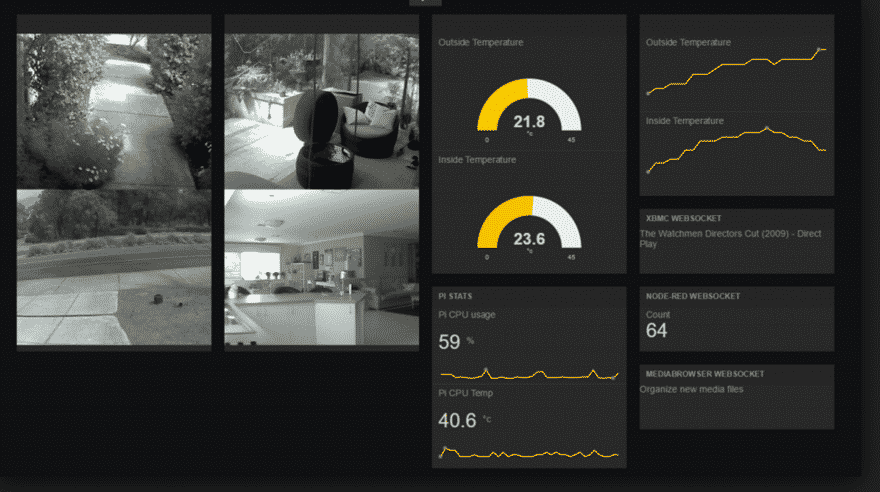
2. Similar to prior implementation, we import the flow from this link. Keep in mind that you have to install dashboard node first, otherwise you may have some issues when importing flow. You could see the dashboard column near the debug column, and then you could change colors and line charts based on your needs especially the chart looking like speed dashboard. You need to set the maximum and minimum so that the test value would show in between.
3. After setting up, you can visit http://{ The name of your application}.mybluemix.net/loramap by clicking “Deploy”, and see the designed chart with numbers fluctuating according to the number you set. If it fluctuates, it means that the IoT monitoring interface setting has been finished. You can design another monitoring interface if needed.
Summary
If you plan to develop IoT devices, Node-RED would be a good choice. MQTT could be the most effective bridge to communicate with Node-RED. After knowing how to utilize LoRa, Node-RED and MQTT, we believe that you can easily develop most basic IoT devices.
Have any other hardware development problems? Let TechDesign professional project manager provide the consultation for you!
Sign up to become TechDesign member and get the first-hand supply chain news.


